Category: Mathematics
-
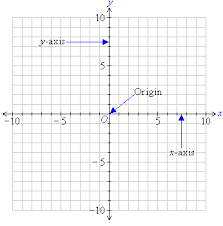
The Cartesian plane
Cartesian plane is used as a frame of reference for points in a line. It has two lines that intersects at the center of a page. This lines are such that they divide a grind page into 4 parts. If you can remember the concept of number lines, the plane is made of two number…
-
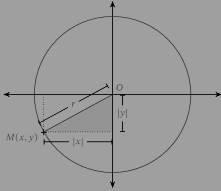
The equation of a circle
The equation of a circle is a fundamental concept especially in coordinate geometry. The equation represents all the points that are equidistant from a fixed point known as the center of a circle in a two-dimensional plane. Consider a circle of radius r on a Cartesian plane centered at point o(a,b) as shown in figure…
-
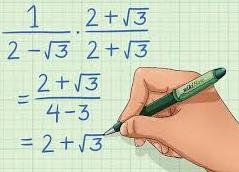
Rationalizing denominators: 3 concise easy methods
Rationalizing denominators is a mathematical technique used to eliminate radicals from the denominator of a fraction. Radicals are mathematical expressions like square roots or cube roots
-
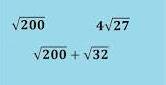
Simplifying surds:3 Easy approach
Simplifying surds refers to the process of simplifying expressions that involve square roots, cube roots, or other root symbols etc. to make them easier to work with or more compact. This often involves: Removing Perfect Squares (or other perfect powers) If the number under the square root or root is a perfect square (or other…
-
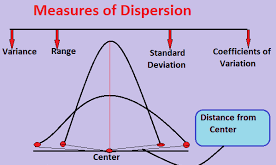
Measures of dispersion: Easy and concise approach1
Measures of dispersion refer to statistical tools that describe the spread or variability of a dataset. They show how much the data points differ from the central value (like the mean or median)
-

concise study of Quartiles and Percentiles
Quartiles divides a set of data into four equal parts. A median divides a set of data into two parts each with equal number of items.
-
1 Effective Data simplification with assumed mean
Data simplification is effectively done by selecting a value known as an assumed mean. Assumed is a value chosen from the data set. It is subtracted from all other values to reduce the size of numbers in the data set
-
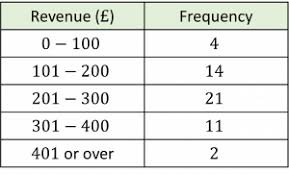
Clear Grouped Data Insights1
Grouped data is a type of data where Individual data points are organized into groups or intervals. This is often done for simplification or analysis. This is commonly done when data is continuous and needs to be represented in a summarized form.
-
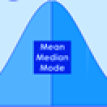
central tendency in statistics 1: Lazy concise approach
Measures of central tendency in statistics are single values derived from the data set. They can be used as the representative of the whole data. In other words, measures of central tendency are statistical tools used to summarize a set of data by identifying the central point or typical value
-
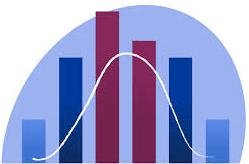
Comprehensive analysis of Histograms and polygons
In this article, we will be discussing histograms and frequency polygons. A histogram is a plot. It lets you discover and show the underlying frequency distribution of a set of continuous data. This allows the inspection of data for its underlying distribution. The common distribution shape can be normal distribution, outliers, skewness, etc. Continuous data refers to…