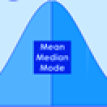

Measures of central tendency
Measures of central tendency in statistics are single values derived from the data set. They can be used as the representative of the whole data. In other words, measures of central tendency are statistical tools used to summarize a set of data by identifying the central point or typical value
The most common measures of central tendency includes:
- Mean
- mode
- Median

Mean a Measure of central tendency
The arithmetic average represents the sum of all data points. It is calculated by summing the values. Then, divide by the number of values. First, find the total sum of all the values in the data set. Then, divide it by the total frequency. That is;
consider the following set of data represents marks scored by a group of students in a math test:
68,65,59,30,42,45,46,59,80,23,54, 45,54,30
The sum of values in the data= 68+65+59+30+42+45+46+59+80+23+54+45+54+30=700
The total frequency of the data set = 14 because there are 14 results in the test
Mean value is interpreted as the value that can result if the data set was modified. This modification would ensure that each item has the same quantity.

Example Problem
10 athletes measured their masses which were recorded and their mean determined as 60.45 Kg. The mass for nine of them were 62.10kg, 58.90kg,56.8kg, 49.70kg, 57.1kg, 64.56kg,58.35kg,55.21kg, 58.67kg but the weight of one athlete was never recorded. Help determine the missing mass.
Solution
let the missing value be x
then total mass for the ten athletes will be 62.10+58.90+56.80+49.70+57.1+64.56+58.35+55.21+58.67+x
frequency = 10 as there are 10 athletes
but mean = 60.45, hence :
hence 604.5 = 521.39+x
x=604.45 – 521.39 = 83.06 kg
Practice Question
Four numbers have the following number of animals: 134, 233, a, 2a. The mean number of animals owned by the farmers is 250. Find a
Mode as a measure of central tendency
Mode is the value that has the greatest occurrence in the data set. That is , Mode is the value that appears most frequently in the data set. There can be more than one mode if multiple values with the same highest frequency.
Consider the following data sets.
14, 33, 16, 15, 12, 16, 10, 17, 16, 13, 15, 11,9,8,14,16
16 is repeated most of the times, hence it is the mode.
Median as a measure of central tendency
The median is the middle value of the data. This happens when the data is arranged in ascending order. In other words It is the middle value when the data is arranged in ascending or descending order. If there is an even number of data points, the median is the average of the two middle values.
If the total number of items is even, then the median is the average of the two middle values. These values must be arranged in ascending order before identifying the median.
Exam problems involving measures of central tendency
- The mass of 40 adults who attended a health clinic were recorded as follows:
64, 50, 58, 73, 51, 42, 58, 46, 58, 60,.
45, 48, 69, 48, 50, 43, 52, 64, 58, 46,.
59, 54, 41, 61, 73, 49, 74, 55, 44, 73,.
53, 67, 62, 47, 66, 52, 60, 61, 54, 70.
(a) Complete the frequency distribution table below for the above information. use classes of size 5 starting with the class 40-44. (4 marks).
| Mass(kg) | Frequency (f) | Mid points(x) | fx | cf |
|---|---|---|---|---|
| 40-44 | ||||
(b) state the modal class
(c) Estimate:
        (i) the mean.                    (2 marks)

        (ii) the median mass.           (3 marks)
2. The diagram below shows a histogram representing the mass in kilograms of 31 people in a medical camp.

(a) Prepare a frequency distribution table for the data. (3 marks)
(b) From the table in (a) above, calculate the;
(i) mean mass; (3 marks)
(ii)median mass. (3 marks)
(c) How many people had a mass of 40 kg and above? (1 mark)
3. The end term test scores of 100 students were recorded as shown in the following table.
| Scores | 30-39 | 40-49 | 50-59 | 60-69 | 70-79 | 80-89 | 90-99 |
| No. of students | 6 | 9 | 27 | 32 | 12 | 10 | 4 |
(a) state the modal class (1 mark)
(b) calculate the median score (3 marks)
(c) On the grid provided, represent the above data using a histogram (4 marks)

(d) Use the histogram to determine the number of students who scored from 71.5 to 76.5
Related Topics
- Introduction to statistics
- Bar graphs
- precisely Integrating trigonometric expressions1
- Grouped and ungrouped data
- Frequency polygon
- Histograms
- Mean for grouped data
- Working with the assumed mean
- Quartiles, Deciles and percentiles
- Measures of dispersion
- Variance
Leave a Reply