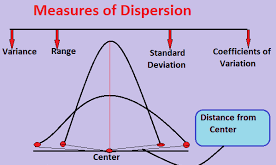

Measures of dispersion refer to statistical tools that describe the spread or variability of a dataset. They show how much the data points differ from the central value (like the mean or median). Common measures of dispersion include:
Range: The difference between the highest and lowest values in a dataset.
Variance: The average of the squared differences from the mean, indicating how spread out the data is.
Standard Deviation: It is the square root of the variance. It provides a measure of how much individual data points deviate from the mean. This measure is in the same unit as the data.
Interquartile Range (IQR): The difference between the first quartile (Q1) and the third quartile (Q3). This represents the range within which the middle 50% of data points fall.
These measures help to understand the consistency or variability of data. This understanding is crucial for making informed decisions based on statistical analysis.
Sometimes measures of central tendency do not give the actual picture of the data in question. If we calculate the average income per home of a certain country, we might find a high value. This leads us fail to deduce that the majority of people have been living below the poverty line. They are overshadowed by a few individuals who earn extremely high incomes. A small number of very high earners raise the average income.
This can lead to incorrect assumptions that people in the country are wealthy. Dispersion can be used to measure how values are spread from the minimum value to the maximum value.
Consider the table below

The table shows scores of some students in a Math and English test.
A mean can fail to show that a class has an extreme case of a bright student. It may also miss an extreme case of a not so bright student. The first data shows that all the students in class are of average ability.
The data in math has a small range of 68-58=10 but English has a wide range of 93-19=74. The two subjects have the same mean. Their totals are the same but Marks in B are more spread out than in A.
One measure of dispersion is the range. It represents the difference between the highest and lowest value in the data set. A range may have limitations. It uses two extreme values that may have strayed from the true picture of actual observations.

A country may have lower value for income per home. However, the quality of life is high. There are no cases of extreme poverty. The gap between rich and poor is not that wide, unlike what happens in Africa.
Inter-quartile range
It is the difference between the lower and the upper quartile. It consists of 50% of the whole data. This portion is usually close to the mean and other measures of central tendency.
Semi inter-quartile range as Measures of dispersion
It is also called the quartile deviation and it represents the average between upper quartile and the lower quartile. It is usually obtained by adding lower quartile and upper quartile then dividing by two.
Mean deviation as Measures of dispersion
Mean deviation is the difference between each value and the mean for the data. It is obtained by subtracting the mean from each value of the data set. The table below shows deviation from the mean of the math and English test shown above. please note that the sum of deviations from the mean is zero.

Mean absolute deviation
The sum of deviations from the mean sums up to 0. This is because mean is usually at the center of all values in the data set. Subtracting means from values left of the mean gives negatives deviation and those from right gives positive deviation. The table below shows that extract of columns of deviations from the mean of the previous data.

To obtain meaningful insights from the deviations from the mean, the negative values are ignored. This ensures that only positive values are considered. Hence we talk about the absolute values from the mean.
First, calculate the absolute deviations from the mean. Then, sum these deviations. Finally, divide the total by the frequency to obtain the mean absolute deviation.
Consider deviations from the mean from the previous data we have discussed. Now we have ignored the the negative sign and included only the number alone without considering it’s sign as shown.

As can be seen from the table above, the mean value for math is only 2.25 whereas for English where the range is big, the mean is 26.5, which is much higher compared to math.
Variance as a measures of dispersion
Instead of finding absolute values, we square each deviation so that each deviation results is made positive.
Variance is the sum of the squared deviations from the mean, divided by the frequency.
Leave a Reply