Tag: Histograms and polygons
-
Comprehensive analysis of Histograms and polygons
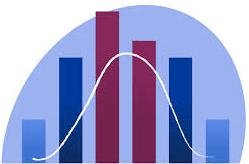
In this article, we will be discussing histograms and frequency polygons. A histogram is a plot. It lets you discover and show the underlying frequency distribution of a set of continuous data. This allows the inspection of data for its underlying distribution. The common distribution shape can be normal distribution, outliers, skewness, etc. Continuous data refers to…