Tag: pie charts
-
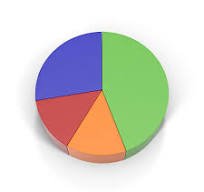
Pie charts: easy concise Introduction 1
Pie charts are a circular graphs. A circle is divided into sections, each representing a frequency of an item in the data set. A pie chart shows the relative contribution that different categories contribute to an overall total. They are used to show percentage or proportional data. The percentage represented by each category is provided next…