Introduction to statistics will guide us on the basic concepts as used in statistics. Statistics is the science of data collection, organization, representation and interpretation of data or information. It plays a vital role in decision-making across various fields, including business, economics, science, and social sciences. The topic is divided into two main areas: descriptive statistics and inferential statistics.
- Descriptive statistics involves summarizing and organizing data. Introduction to statistics will expose us to tools include mean, median, mode, and standard deviation. Graphical representations like histograms and pie charts are also used. It helps in understanding the basic features of data.
- Inferential statistics focuses on making predictions or inferences about a population based on a sample. Techniques like hypothesis testing, confidence intervals, and regression analysis are used to estimate population parameters and test assumptions.
Statistics also includes the study of probability, which underpins many statistical methods by assessing the likelihood of events. Overall, statistics is crucial for making informed decisions and understanding patterns in data.
Please note the difference between statistics and statistic.
Statistic
Statistic is a collection of information shown in numbers. For example the number of people that browse a a web in a day is a statistic.
introduction to statistics: Data as used in statistics
Data is used to mean fact or information which needs examination or processing to extract useful information. For example counting the number of people in a location is data collection. Data collection is described as gathering of facts that are used for information processing.
Examples of data collections include:
- The number of items sold per category of items sold in the supermarket
- The number of crimes or cases reported to a police station daily
- The average fuel consumption of a country in a month
- Number of people infected with HIV virus per day
- The average rainfall of an area over a given period
Introducing statistics : Data representation
Data collected should be presented in a way that is most useful to the consumer. This means it should be represented in a way that is convenient and easy to understand. Data that is well represented will be understood and be interpreted easily.
Some of the techniques used to represent data includes
- Listing the data in a chronological order
- pictograms (picture graphs)
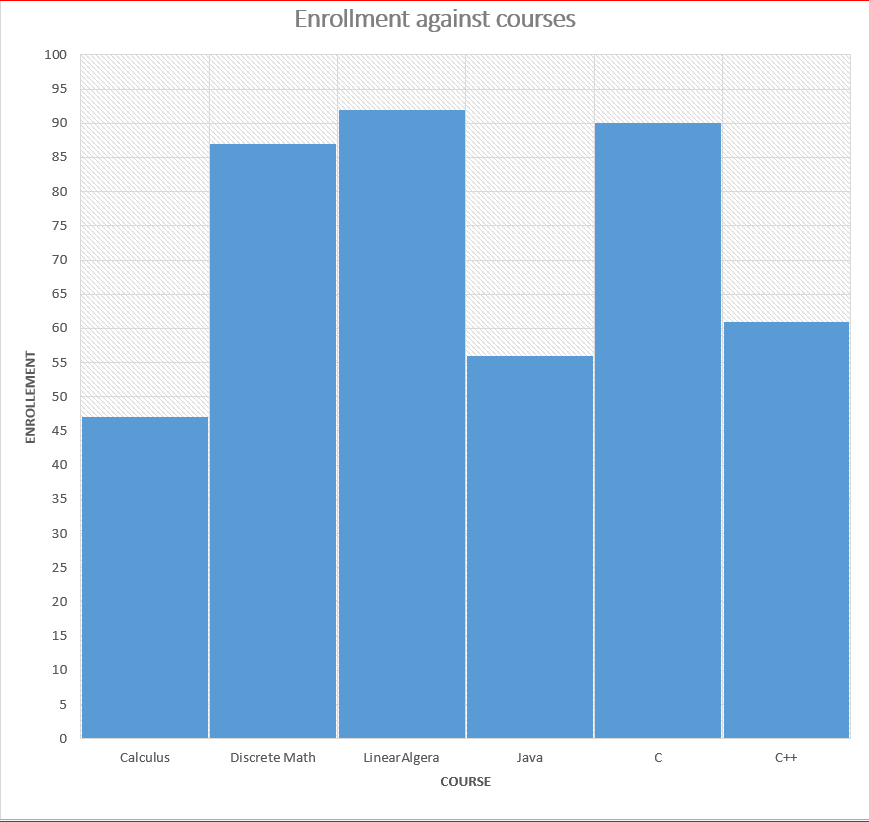
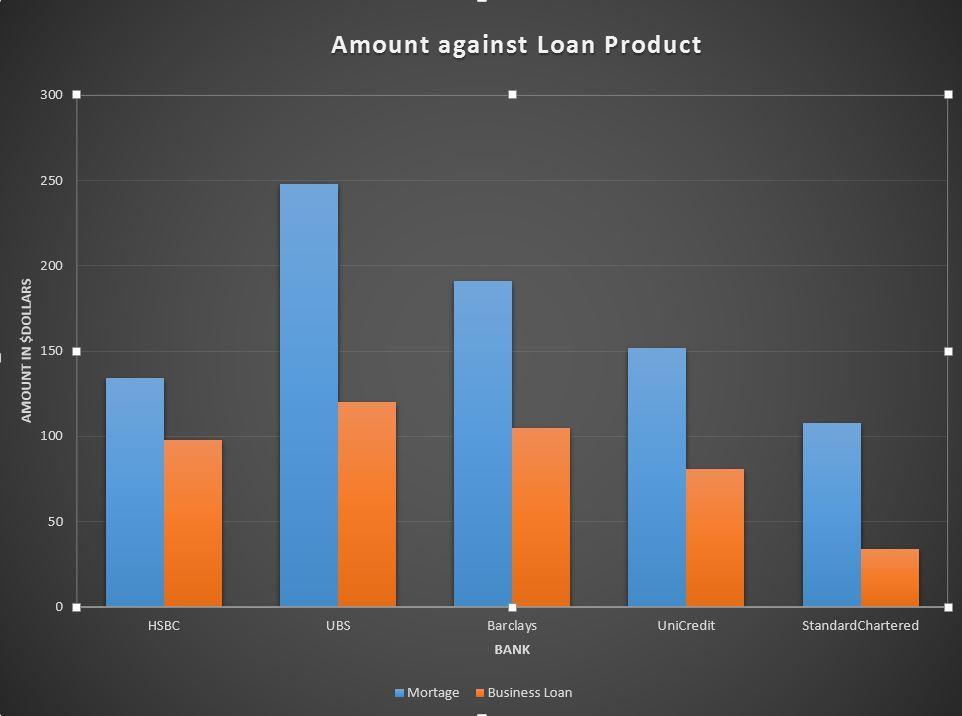
- bar charts
- pie charts
- histograms
- Frequency tables
Listing of data
Listing data is simply putting down the actual numbers representing a quantity of an item in a data set. for example consider a class of 20 students that are in a computer science class that sits for a test and scored the following marks in percentage:
82, 70, 79, 61, 56, 67, 80, 60, 55, 62, 65, 73,74, 76, 67, 78, 83, 68, 59, 49.
Above represents a list of marks as recorded by the teacher from the students scripts. A list of numbers is not very useful on its own. However, we can make it more meaningful by arranging the items in ascending or descending order.
From the ordered list, one can determine the highest value and the smallest value. One can also find the value that is repeated most often. Additionally, you can identify the value that is in the middle.
If you can consider the data above, it’s ordered list will be as follow:
49, 55, 56, 59, 60, 61, 62, 65, 67, 67, 68, 70, 73, 74, 76, 78, 79, 80, 82, 83.
The lowest value is at the beginning of the list. The largest value is at the end of the list. As you can see from the list.
Please note that the value that are repeated are placed next to each other.
To get to the middle we simple divide the list size by two. For example, in the above list, we find the middle by getting a value between the 10th and 11th positions. We will be talking more about the mid value in the upcoming lessons.
Exercise 1
Marks scored in an English test by a group of 17 students were recorded. The total was out of 30 possible marks.
17, 18, 12, 13, 15, 14, 17, 23, 14, 27, 24, 16, 23, 14, 21, 14, 13.
- List the scores in ascending order
- which is the most common score
- how many scores above the common score
- what is the difference between the largest and smallest value
- what significance can you draw from number 4 above
- which score is in the middle.

Frequency tables
Frequency means the number of times a value is recorded or observed. It means the count of a particular value in a data set.
A tally mark (/) is made for every occurrence of an item while counting the scores. Every 5th occurrence is stroked across the other four ////. The result of tallying is placed on a table. The value makes one column. Tallying is another column. The frequency is another column. From the table, much more manipulation of data can be done. We are likely to see that in other lessons.
Data Manipulation in statistics
consider the data below:
82, 70, 79, 61, 56, 67. 80, 60, 67. 55, 62, 65. 73, 74, 76. 67, 78, 83. 68, 59, 67. 49, 64, 80. 79, 60, 55. 73, 73, 67. 74, 61, 73. 82, 83, 73, 67.
We will make a table of three columns. In the first column, we will list every unique value that is represented in the data. The second column we will put the tallying and the third column we put the result of the tallying.
| Mark | Tallying | Frequency |
| 49 | / | 1 |
| 55 | // | 2 |
| 56 | / | 1 |
| 59 | / | 1 |
| 60 | // | 2 |
| 61 | // | 2 |
| 62 | / | 1 |
| 64 | / | 1 |
| 65 | / | 1 |
| 67 | 6 | |
| 68 | / | 1 |
| 70 | / | 1 |
| 73 | 5 | |
| 74 | // | 2 |
| 76 | / | 1 |
| 78 | / | 1 |
| 79 | // | 2 |
| 80 | // | 2 |
| 82 | // | 2 |
| 83 | // | 2 |
| Total | 37 |
A frequency distribution table
Exercise 2
The next are scores in a math class for 21 students :
35, 30, 27, 29, 32, 31, 28, 27, 29, 30, 31, 29, 29, 34, 29, 30,27, 28,31, 31, 3035, 30, 27, 29, 32, 31, 28, 27, 29, 30, 31, 29, 29, 34, 29, 30,27, 28,31, 31, 30
- Arrange the data in descending order
- Make a frequency table for the data
- What is the most common mark