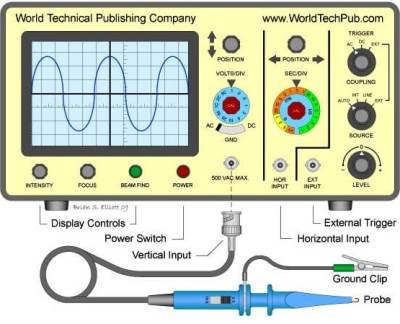
Some uses of C.R.O includes measuring of electrical potential as a voltmeter, television displays and in measuring frequency of signals.
Uses of C.R.O as a voltmeter
C..R.O can be used as a voltmeter when it time base circuit is switched off and the voltage to be measured is connected across the Y-plates while the X-plates are earthed.
The vertical displacement of the bright spot on the screen is measured and the sensitivity of the C.R.O is adjusted to determine number of volts per units of displacement along the vertical scale.
The number of volts per unit of division is the sensitivity. The voltage can the be determined as:
Voltage = displacement x sensitivity
Sensitivity is adjusted using the Y-gain knob which automatically connects the input signal through an application system.
Amplification system ensures that even very signals are raised to the levels where they cause measurable deflection of the beam.
C.R.O is considered a superior voltmeter compared to convectional ones because of the following reasons:
- can measure large voltages without being damaged
- can measure both direct and alternating voltages
- Has infinite resistance hence takes no current meaning that it rarely interferes with the circuit into which it is being connected.
- It responds instantaneously unlike ordinary meters whose meters swings momentarily about the correct reading due to inertial.
Example Problem on usage of C.R.O as a voltmeter
A D.C voltage of 80V when applied to the Y-plates of a C.R.O causes a deflection of the spot as shown in figure below:

(i) Determine sensitivity of the y-gain
(ii) show what will be formed on the screen if an a.c of peak voltage 64V
is fed onto the Plates.
solutions
(i)
spot deflection on the screen from the center of the screen = 5 divisions
Voltage = displacement x sensitivity
hence
=16V per division (16V/div)
(ii)
peak voltage=64
Voltage in a.c with be a straight line 4 divisions above the central line and 4 divisions below it as shown below

Example
The Y-gain of a CRO has a sensitivity of 500V/div. An a.c voltage of 2500V is connected across the Y-plates. show what is observed on the screen.
solution
Voltage = sensitivity x number of divisions
We need to determine the number of divisions that a signal will be displaced vertically.
Hence a straight vertical line will be formed on the screen covering 5 divisions above the x-axis and 5 divisions below it as shown

Using C.R.O to measure frequency of an a.c signal
The signal is fed into the Y_plates of a C.R.O with the time base on. The time base control is then adjusted to give one or more cycles of the input signal on the screen. By adjusting the time base control, we can determine the number of cycles made on the screen from the periodic time T. Frequency can then be calculated from f=1/T.
Example
Figure below shows a trace on the screen for an signal connected to the Y_plates of a CRO with time base on.

Given that the time base control is 20ms/div and the Y-gain is at 80V/div, determine:
(i) frequency of the a.c signal
(ii) The peak voltage of the input signal
solution (i)
Time base settings is 20ms/div
Number of waves shown on the screen =3.25
7 div is covered by 2.5 waves.
1 wave = 7.0/2.5 = 2.8 divisions
Time taken to complete 1 wave (periodic time) = 2.8 div x 20ms/div = 56ms = 56 x 10-3s
And so the frequency will be given by:
0.01786 x 10³ Hz =17.86 Hz
solution (ii)
Y-gain =80div
Approximate deflection as about 2.2 divisions as per the graph
Peak Voltage = Y-gain x number of divisions
= 80 x 2.2 = 176 V
Related Articles
June 15, 2024
- Detecting of Electromagnetic waves
- The cathode ray oscilloscope (CRO)1
- Introduction to cathode rays
- &larr


Leave a Reply