
For a given metal surface, the kinetic energy gained depends on the excess energy of radiation. This happens after the electron has been extracted to the surface.
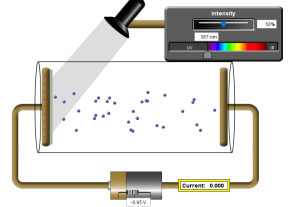
consider the setup below:

The monochromatic light passes through a filter which allows only radiation of a certain frequency to reach the cathode. The filtered light is then made to fall on the cathode.
The current is recorded on the micro-ammeter when electrons are extracted by the filtered radiation. The current is recorded because electrons are accelerated towards the anode. The radiation’s energy exceeds the cathode’s work function and gives the electrons kinetic energy.
The potential difference V is meant to oppose the movement of the electrons by providing energy that arrests their kinetic energy.
For Each radiation, the potential difference is varied by moving the jockey J between X and Y until no current is registered.
When the current is adjusted to zero when electrons are being ejected, the energy given by the potential difference equals kinetic energy of the electron.
The battery is connected such a way that it opposes the ejection of the electrons by attracting the photoelectrons back to the cathode.
The voltmeter reading gives the stopping potential for a given frequency.
Graphing energy of radiation
The following table shows stopping potentials when some given light frequencies are incident to the cathode.
| Color | Frequency f( x 1014 Hz) | Stopping potential Vs |
|---|---|---|
| Violet | 7.5 | 1.2 |
| Blue | 6.7 | 0.88 |
| Green | 6.0 | 0.60 |
| Yellow | 5.2 | 0.28 |
| Orange | 4.8 | 0.12 |
From the table we can plot the graph of stopping potentials against the frequencies to obtained the following graph.
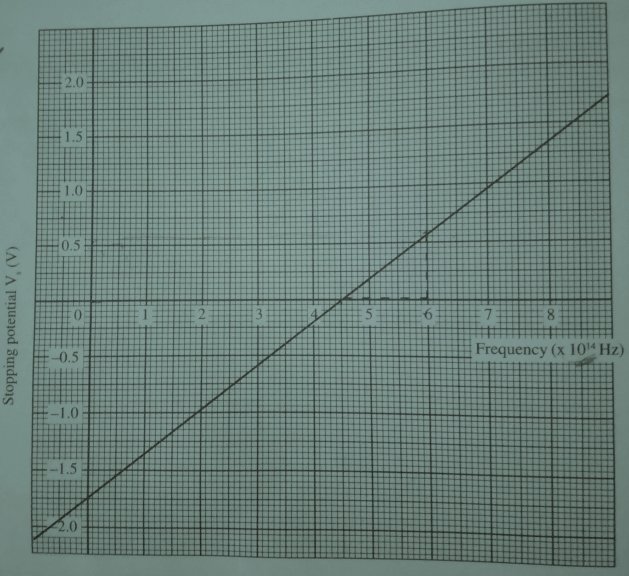
From the graph, we can see that the plot gives a straight line that cuts both axis of the graph. The Einstein’s photoelectric equation is stated as:
The work done by stopping potential is given by eVs.
Work done by stopping potential is equal to the kinetic energy of the photoelectrons according to work energy theorem. That is:
substituting in the Einstein’s equation of photoelectric effects.
therefore;
making Vs the subject, we get:
hfo = Wo and so the graph of Vs against f is a straight line cutting the f-axis at fo.
The slope of the graph is h/e and the Vs intercept is -Wo/e.
We can therefore extract plank’s constant h and the work function Wo from the graph.
Leave a Reply