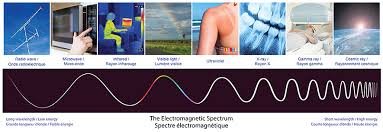

The energy of radiation is the energy emitted by matter. It is released in the form of waves and is proportional to its frequency. The stopping potential refers to the voltage needed to stop the most energetic photoelectrons. These photoelectrons are emitted from the surface of a material. When that energy fall on metals, electron can be logded out of such metals unto which the energy falls. The possibility of dislodging an electron by radiation on a metal surface relies on the metal’s internal energy. This energy holds the electrons towards the nucleus. see the figure below

The energy provided by a radiation needs to overcome this attractive forces so that electron can come to the surface. If the energy absorbed by the electron is more than what is needed to break attractive forces, the electron accelerates from the metal surface. The accelerating electron uses the excess energy from the radiation as the kinetic energy
Consider the circuit below:
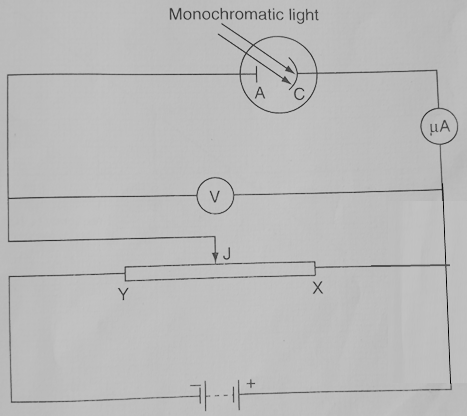
Different filters are placed before the photocell so as to allow only certain frequency of light fall on the cathode.
For each color filter, we vary the potential difference by moving the jockey J between X and Y. This continues until we register no current. This is because the battery is connected such that it opposes ejection of electrons. This is done by attracting photoelectrons back to the cathode. The reading of the voltmeter represents what is known as the stopping potential for the given frequency.
Using different color filters to extract certain frequencies from the radiation, a table as below is obtained.
| color | Frequency f(a x 1014 Hz) | Stooping potential Vs |
|---|---|---|
| Violet | 7.5 | 1.2 |
| Blue | 6.7 | 0.88 |
| Green | 6.0 | 0.60 |
| Yellow | 5.2 | 0.28 |
| Orange | 4.8 | 0.12 |
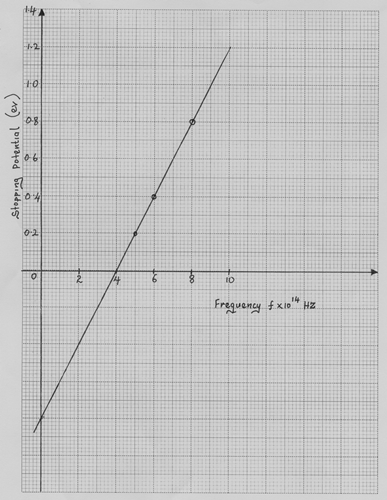
After obtaining the table, the stopping potential is plotted against the frequency to obtain the following graph.
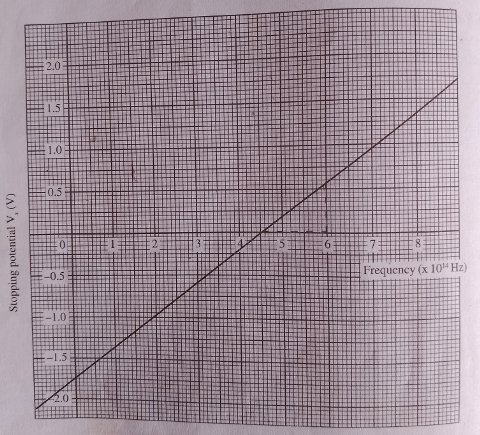
As can be observed, the graph is a straight line with a positive gradient. From the Einstein’s equation of photoelectric effect:
vmax is the maximum kinetic energy that can be obtained by the electron after it is dislodged from the metal surface.
The work done by the stopping potential is given by:
making substitutions in the Einstein’s equation, we obtain:
therefore;
expressing the Vs as the subject of the formulae:
We see that the the graph cuts frequency axis at fo .
remember that wo=hfo . therefore, we have
the slope of the graph gives h/e while the Vs intercept gives -Wo/e. we can therefore obtain work function and the plank’s constant from the graph.
From the graph used in this text, we can get threshold frequency of the metal as follow:
From the equation eVs = hf – hfo
at the Vs intercept, Vs=0 and so
and so f = fo at the Vs intercept.
from the graph, the intercept is 4.5 x 10¹⁴Hz which is the threshold frequency for the said metal.
the slope for the graph is given as:
we pick two points from the graph to calculate the gradients. let have the points: (2.0, -1.0) and (8.0, 1.35)
the slope becomes:
but
therefore:
from the graph we can determine the work function from the relation:
Wo = hfo
that is: Wo = 6.266672 x 10-34 x 4.5 x 1014 = 2.82 x 10⁻¹⁹ J
and 1 eV = 1.6 x 10⁻¹⁹J
hence the work function in electron volts will be given by:
Exam problems involving stopping potential
- Light of frequency 7.5 x 10¹⁴ Hz strikes a metal surface whose work function is 4.0 x 10⁻¹⁹ J. Determine the kinetic energy of the emitted photoelectrons. (take plank’s constant h as 6.63 x 10⁻³⁴Js)
- Electrons are emitted from a metal surface when it is illuminated with suitable electromagnetic radiation . The variation of frequency f with the maximum kinetic energy E of the emitted electrons is shown in the graph.
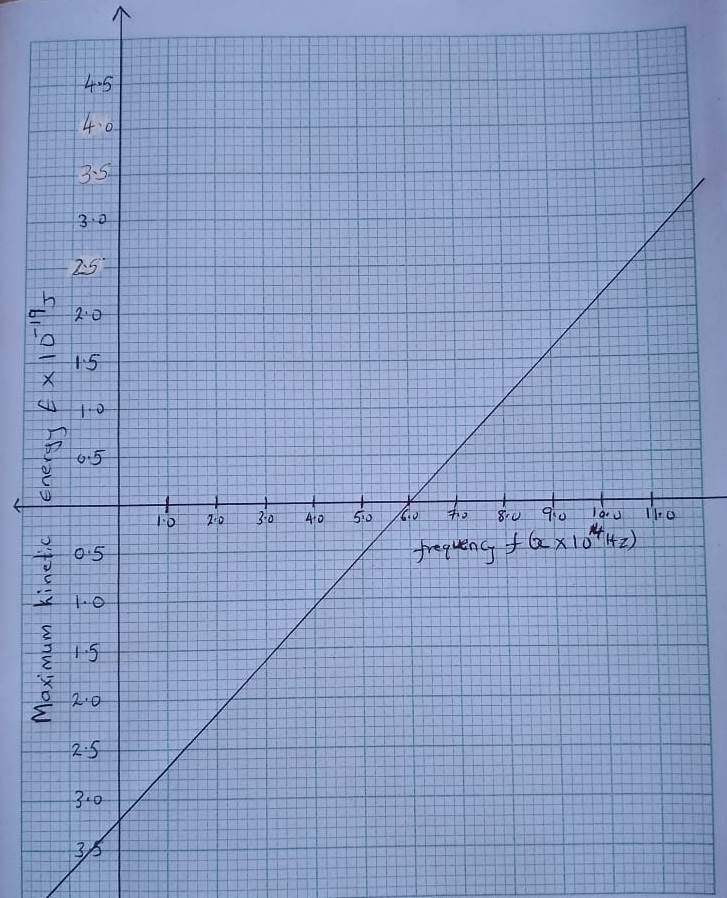
Use the graph to determine:
(i) The threshold frequency of the given radiation (1 mark)
(ii) The value of the plank’s constant in that context (3 marks)
(iii) the work function of the metal (1 mark)
3.(a)  Define the following terms:
      (i)  Photoelectric effects

      (ii) Cut-off potential

  (b) State two factors that affects photoelectric (2 marks)

  (c) Explain why ultraviolet light causes a negatively charged
      electroscope to discharge but not a positively charged one
      (2 marks)
  (d) Determine the minimum frequency required to
      cause photoelectric on a surface with a work function of
      6.0 eV given that 1 eV  = 1.6 x 10⁻¹⁹ J and plank's constant
      h = 6.626 x 10⁻³⁴ Js.     (3 marks)


(e) suppose that the metal in (d) above is illuminated by
    a radiation with a photon energy of 4.8 eV.

     (i) what will be the effect on the photo electrons? (1 mark)

     (ii) Convert this photon energy to joules   ( 2 marks)
4. The fig. below shows a photo – cell.

What factor determine the kinetic energy of the electrons emitted, hence show the relationship
5. a) What is meant by the term photo – electric effect.(1 mark)
b) The figure below shows an arrangement used to investigate photo-electric effect.

(i) Name the parts marked P and Q (2 marks)
(ii) State three measurable quantities in this set up (3 marks)
(iii) State how the intensity of light affects the photo – current. (1 mark)
(c) The results obtained for various monochromatic radiations of
     different colors are shown
(i) The graph indicates that there is a frequency below which
    no electrons are emitted. Explain why this is so (1 mark)
	   (ii) From the graph determine;
		 (a). Plank’s constant, h (4 marks)
                       (Take electron charge, e = 1.6 x 10⁻¹⁹C)

		 (b). The work function of the metal. (3 marks)

		 (c). Sketch on the same graph, the expected
                      graph of another metal which has a lower
                      work function than the metal used. (1 mk)
6. The graph in Figure shows the variation of frequency of radiation f with the greatest kinetic energy of the emitted electrons.

From the graph determine
      (i) Plank’s constant (4marks)


     (ii) Hence or otherwise calculate the work function of
          the metal.(3mks)
7.Calculate the wavelength of Green light whose energy is
 3.37 x 10⁻¹⁹J.(h=6.63 x 10⁻³⁴ Js, C= 3.0 x 10⁸m/s) (3mks)
8.The table below shows the kinetic energy of photoelectrons for various radiations for a given photo emissive surface.
| Kinetic energy x 10-19 J | 0.42 | 1.47 | 2.10 | 2.73 | 3.36 | 3.78 |
| Frequency x 1014HZ | 4.50 | 6.00 | 7.00 | 8.00 | 9.00 | 9.75 |
(i) Plot a graph of kinetic energy (y axis) against the frequency (x – axis)		(5mks)


(ii) Use the graph to find h the Planck’s constant 					(2mks)


iii) From the graph determine the work function of the surface 			(2mks)


(iv) State 3 factors that affect the photoelectric effect					(3mks)


(v) State two applications of photoelectric effect 					(2mks
9. (a) State one factor that affects photoelectric effect. (1 mark)
   (b) In a photoelectric effect experiment, a certain
       metal surface was illuminated with radiation of
       different frequencies the. Table below shows the
       variation between frequency and stopping potential.
| Frequency f, (Hz) (x1014) | 8.2 | 9.1 | 10.0 | 11.5 | 13.0 |
| Stopping potential, Vs (V) | 0.2 | 0.6 | 1.0 | 1.6 | 2.2 |
(i) Plot a graph of stopping potential (y-axis) against frequency. (5 mks)
(ii) Use the graph to determine Plank’s constant and threshold frequency of the metal. (3 marks)
c) (i) Distinguish between conductors and semi-conductors in terms of change in resistance on heating. (2 mks)
(ii) Explain how a P – type extrinsic semi-conductor can be made from pure silicon. (2 marks)
10. The table 2. below shows stopping potential (volts) and frequency obtained from an experiment of photoelectric emission.
| Stopping potential (volts) | 0.6 | 1.0 | 1.4 | 1.8 | 2.2 | 2.6 |
| Light frequency x 1014 (Hz) | 6.0 | 7.0 | 8.0 | 9.0 | 10.0 | 11.0 |
(i) Plot a graph of stopping potential against frequency. (4mks)
(ii) From the graph determine;
(a) The Threshold frequency and wavelength. (2mks)
(b) The plank’s constant. (3mks)
(c) Work function. (2mks)
11. Give a condition necessary for electrons to be emitted from the
cathode of a photocell (1mk)
(b) In an experiment using a photocell, ultraviolet light of varying frequency strikes a metal
surface. The maximum kinetic energy (K.E max) of photoelectrons for each frequency, f, is measured. The graph below shows how the maximum kinetic energy varies with the frequency, f
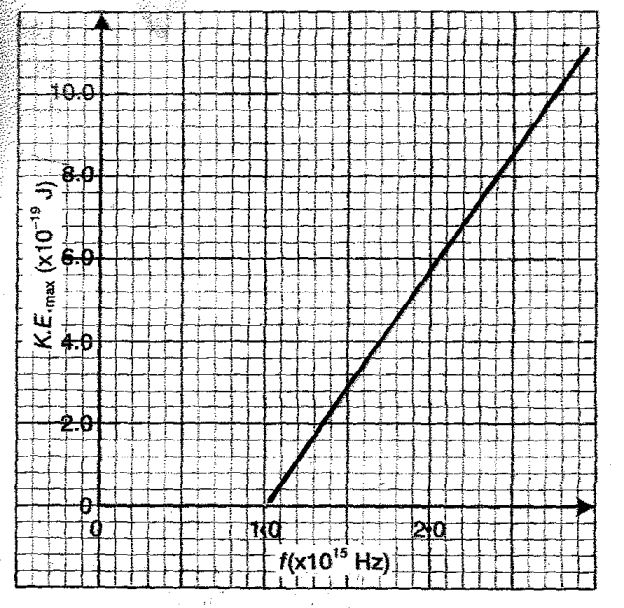
use the graph to determine:
(i) Threshold frequency fo (1 mark)
(ii) Planck’s constant, h (3mks)
iii) Work function of the metal (3mks)
Related Topics
- Introduction to Social Psychology
- The Einstein’s Equation: 7 important Insights
- The Quantum Theory
- Introduction to Photo Electric Effect
Leave a Reply