They are nice visual tools used to represent set operations by displaying sets as intersecting circles and shading out results of of set operations.
The also represents cardinality of a particular set by putting the number in the corresponding region in the diagram.
Venn diagrams are frequently used to build intuition for proofs. The diagrams are designed to represent the general pictures of what is known helping a person to see the theoretical relationships among sets.
The universal set
The universal set is represented by a rectangle such that points in the rectangle represent the elements of a universal set as shown.

Intersection of sets
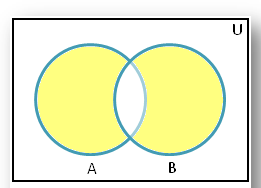
Two sets A and B when they intersect will be represented by two circles that will have a common region. The common region will have the results of intersection as shown in figure below.
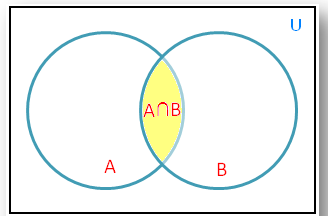
The region shaded with color represents results of intersection operations. The region labelled A represents all elements in set A alone which are not in B.
The figure below shows intersection of three sets A, B and C.

Union of sets
From our previous lessons, we were able to see that, union of two sets consists of elements in either sets or in both. The union of two sets will be represented by shading the two circles completely as the elements of union will be in either circles or in both as shown in figure below.

The figure below shows union of three sets A U B U C

Difference in sets
Set difference between A and B (A-B) or A\B represents elements of Set A that are not in B. The figure below represents set difference between A and B

If we can put it in other words, the difference of two sets A and B taken in this order is the set of all those elements of A which are not in B.
we can write:
A – B = {x : x ∈ A and x ∉ B} i.e. those elements in A but not in B
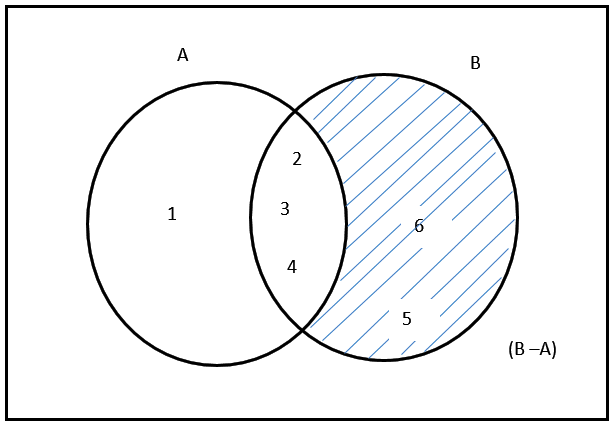
B -A =B – A = {x : x ∈ B and x ∉ A} i.e. those elements in B but not in A
let A = {1, 2, 3, 4} and B={2, 3, 4, 5, 6}; then
A – B = {1} and B – A = {5, 6}
The representation of the set difference A -B is represented by a Venn diagram as shown below:
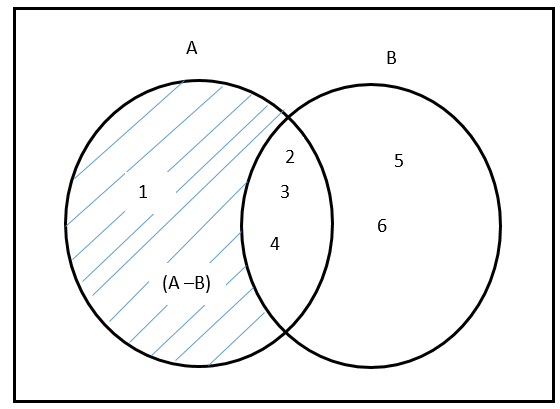
The shaded region in the figure above is the result of A\B which is {1}.
The set difference between B and A as shown in the figure below
Venn diagrams for the subsets
Subsets of the universal set are represented by circles or ovals in the rectangle as shown

Suppose A, B and C are subsets of the universal set U. The region within the circle A represents the elements of A and region around B elements of B and similarly for C.
In the figure above, A is a subset of B, that is, A ⊂ B and A and C have no common elements hence they are not intersecting.
Theorem: Let A, B and C be sets. If A ⊆ B and B ⊆ C, then A ⊆ C.
In the figure below A ⊆ B and B ⊆ C and so such relationship is represented with centric circles where A is inside B and B inside C and A and B are inside C but the the three circles are not intersecting.

Disjoint sets
if two or more sets are not intersecting but are within the same universe , then they are represented by two circles next to each other as shown. such sets are said to be disjoint sets

In the figure above A , B and C are sets that have no common elements among them; for example let A equals sets of counting numbers between 0 and 9.
let A = {2, 4, 6, 8}, a set of even numbers in the discourse.
let B = {1, 3, 5,7, 9}
then we can represent A and B as shown.

Symmetric difference of sets in Venn Diagrams
The Symmetric difference of two sets A and B is defined as the union of sets A-B and B-A. The symmetric difference of A and B is denoted by A Δ B
Using set builder notation:
A Δ B ={x : x ∈ (A – B) and x ∉ (B-A)}
The set difference between A and B can be represented by Venn diagram as shown
Complement of a set and the Venn diagram
If A is a subset of Universal set U, Then the compliment of A with respect to U is defined as the set of all those elements of U which are not in A.
The compliment of A is denoted by A’ or Ac
A’ = {x : x ∈ U) and x ∉ A }
set compliment is represented as shown below
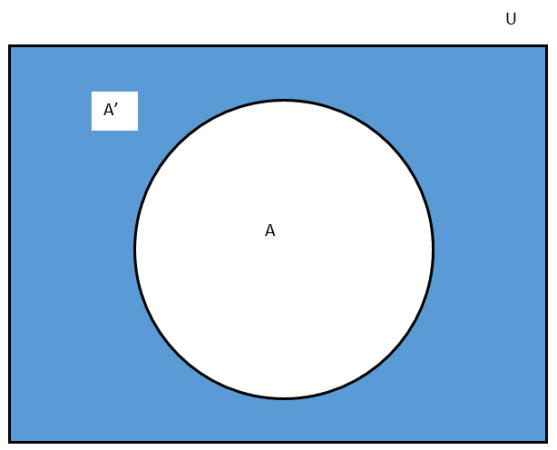
The set compliment of set A illustratedplease note that U = A’ U A
Conclusions
A Venn diagram is pictorial representations of set relationships that uses circles to show the such relationships. Circles that overlap have common elements while circles that do not overlap have no common elements . Venn diagrams help to visually represent set relationships.