Rates are mathematical expressions that shows the relationship between two quantities. It shows how changes of one value is causing change to another variable.
A common examples of rates is when growth is compared with time. Time is an important factor when determining rates. For example when we compare rate of growth of a population over a number of years we are comparing number of people that has been added to the population over a certain period of time, maybe six months or one year, probably through birth or immigration.
A business can determine rate of increase of it’s sales by determine the number of sales across given periods of time like months or years.
Another example of rate is speed that determines how object changes it’s distance from point where it started it’s motion to the change of time.
Example
Calculate the rate of change of flow of oil in a pipeline per minute if an 800000 litres storage tank was filled in 4 hours 10mins.
Solution
The number of minutes in 4 hours and 10mins is (4*60)+10 =250mins.
Rate of flow = numbers of liters flowed/ time taken in minutes
Rate of flow=800000/250 hence
Rate of flow= 3200 liters per min
which we can also write as 3200litres/min.
Note:
The above rate of flow could also be expressed in terms of litres per hour where in that case the number of hours will be 4(1/6) hours which can also be expressed as 25/6 hours.
Hence rate of flow in hours will be:
800000liters/(25/6) hours
Which will be (800000/25)*6 and hence rate of flow=192000liters/hour
Variance is the mean of the squared deviations from the mean.
Instead of finding absolute deviation where we ignored negative signs obtained by subtracting mean from values, we square the difference from the mean. If we had deviation d from the mean, we get another column for d2.
Consider the following set of data:
42, 45, 39, 52, 48, 47, 50, 43, 36, 37
The mean for the data is
42 + 45 + 39 + 52 + 48 + 47 + 50 + 44 +
36 + 37 =440
The table below shows deviation from the mean of data representing some marks in a math test.
from the table above, the sum of d2 is 268. That is Σd2 = 268.00
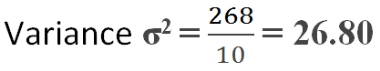
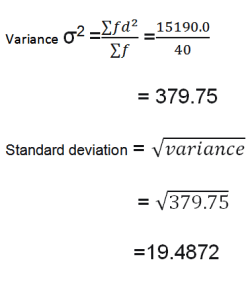
the variance, sometimes written as σ2 is given as Σd2 divided by total frequency N. That is;
In the example above:
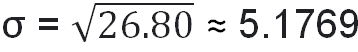
Standard deviation σ
It is also known as the root mean square deviation and is obtained by getting the square root of the variance. In the example above, The standard deviation, sometimes abbreviated as s.d will be given by:
Standard Deviation For a grouped data
standard deviation is useful for a large data.
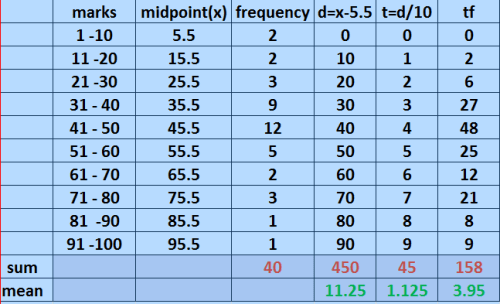
consider the table below that contains marks distribution for some 40 students.
We first calculate the mean for the data using the methods of getting mean for the grouped data.
Here i use the assumed mean of 5.5. I choose this value because it has little value of midpoint and frequency, hence not likely to loose a lot of accuracy when it is reduced to zero
Recall:
From the table above:
∑ft/ ∑f = 3.95
and (∑ft/ ∑f) x 10= 39.5
hence (∑fd/ ∑f) = 39.5
Mean is therefore 39.5 + 5.5 = 45
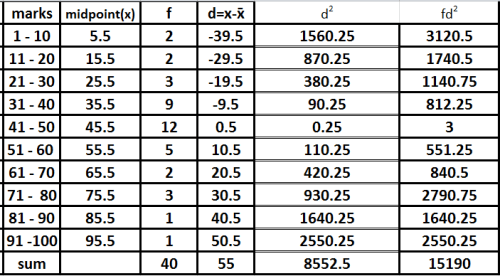
Now that i have the mean, i will make a table that contains deviations from the mean and the squared deviation from the mean as shown.
The we will proceed to calculate the variance and get it’s squareroot to get the standard deviation.
if you know the tangent ratio of a given angle, you already know that the ratio is a result of dividing opposite side over tangent. If you know the length of one side, the you can get the other.
let us say there exits an angle θ that has a tan ratio of 0.821 and the side opposite to it is 8.5 cm. Then the adjacent side can be obtained as follow:
Example
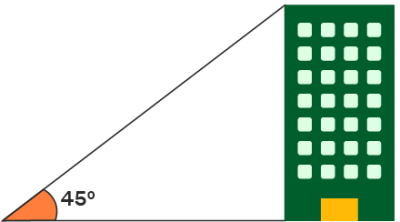
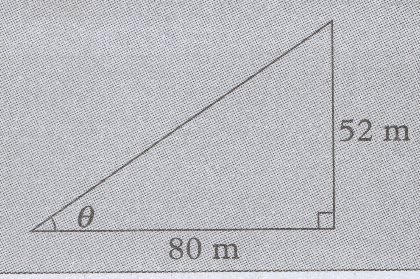
Find the length BC in the figure below:
solution
The side BC is the opposite side and line AB which is the adjacent side to angle θ which is equal to 70o is equal to 25cm. Then we proceeds as follows:
Exercise Questions
Use tangents to find the lengths of the side marked x in the below tri-angles.
Q1: Find the unknown side in each of the following
(a)
(b)
Q2: Find the unknown angle θ,α in each of the following triangle
Each angle from 0o to 90o has a unique tangent ratio which is made when two lines meet to make it.
Every combination of opposite and adjacent lines that makes a right angled triangle has a unique angle which they make.
If we know the acute angle in a right angled triangle, we can use tables of tangents to find it’s corresponding tangent ratio. Similarly, if we know the angle and just one side, we can find the ratio of the angle and then use the tangent relationship to find the other side.
The table of tangents consists of angles of 0o to 90o expressed in 4 significant figures whose tangents has been recorded. All we need to do as mathematician is get a certain angle and find it’s corresponding ratio from the tables.
Angles in the table of tangents are expressed in degrees and points of degrees as well as in minutes. 1 degree (1o) is equivalent to 60 minutes(60′).
The table of tangents is divided into three major columns as shown in the table extract below:
The first column is the column with the column head labelled xo which represents whole number degrees from 0o to 90o .
The second column consists of 0.0o to 0.9o which divides a degree into 10 smaller units hence giving an accuracy of 0.1o.
The third column is the one labelled ADD column and provides the second decimal value of the angle. Using the table of tangents, we can find angles upto to second decimal places.
Example
Determine the tangent of 36.57o
solution
In the column labelled xo , look for the row headed 36 and then move along this row until you reach 0.5. The number at the intersection of 36 and 0.5 is 0.7400
note that the number is recorded as 7400 and not 0.7400. This is done to save on space but you should check the first column after 36, That is, column headed 0.0, whatever value that is stated on that row in that column should be used as the starting value for all the columns in that row.
so tan 36.5 =0.7400, to get the value for tan 36.57, we go to the add column and check on the column 0.07 and add it’s value on the far right of our previous value we read from the table. In this case it is 19 and should be read as 0.0019
hence tan 36.57 should be 0.7400+0.0019 = 0.7419
Example
Use tables to find the tangent of 77o48′
solution
1o=60′, hence 48′ = (48′ x 1o)/60′ = 0.8o
then 77o48′ can be expressed as 77.8o
From the tables, you identify row 77 at xo column then move upto to the column 0.8 and read off that value at the intersection. This value is 0.6252 hence tan 77o48′ = tan 77.8o = 0.6252
Angle θ is sitted on line AB and it faces line BC. AB makes a right angle with BC.
AB is refered as the adjacent side of Angle θ because the θ lies on it.
Side BC is known as the opposite side of angle θ because θ directly faces it.
In the figure shown above, BC=8.70cm and Ab=9.90cm.
I introduce a new line DE, FG, ,IJ, KL and MN all parallel to BC shown.
The ratio BC/AB = 8.70cm/9.8cm = 0.8876 to 4 decimal places.
similarly the ratio DE/AE = 7.2cm/8.2cm = 0.8780
FG/AG = 5.6cm/6.3cm = 0.8888
IJ/AJ = 4.0cm/4.6cm = 0.8696
KL/AL = 2.7/3.1 = 0.8710
MN/AN = 1.7/1.90 = 0.8947
As can be seen, all the ratios of opposite sides over the adjacent sides is approaching a constant value an all will be 0.9 when rounded to 1 decimal places. Further investigation of ratios of opposite sides versus adjacent sides reveals that such a ratio gives a constant value for a given angle. Such constant value is the tangent of that angle θ and is referred to as the tangent of angle θ usually denoted as tan θ .
By definition, the tangent of a given angle is the ratio of the opposite side to the adjacent side. That is:
and in short form:
Exercise
Express tan θ as a fraction in the figure below
Solution
practice question
Study the triangle below an express the angle θ as a tan ratio leaving your answer as a fraction.
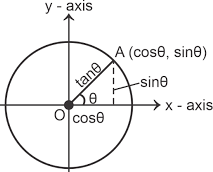
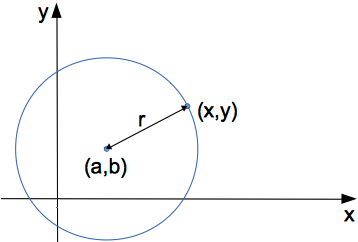
Consider a circle of radius r on a Cartesian plane centered at point o(a,b) as shown in figure below. A point p on the circumference of the circle has an arbitrary point (x, y).
line OQ an QP makes a right angle triangle with the radius r of the circle such OP=r, OQ = x-a and QP=y-b.
using Pythagoras’ theorem: (x-a)2 + (y-b)2 = r2.
Hence the general equation of a circle is given as:
(x-a)2 + (y-b)2 = r2.
where:
r is the radius of the circle
(a, b) are the coordinates at the center of the circle
(x,y) is an arbitrary point on the circumference of the circle.
Example
Find the equation of a circle centered at (4, 5) and with radius of 3 units.
Quartiles divides a set of data into four equal parts.
A median divides a set of data into two parts each with equal number of items.
The first quartile, mostly referred to as the lower quartile contains 25% of the total data items. Lower quartile can be described as the median of the bottom half.
Second quartile is actually the median of the whole data(50%).
The third quartile is usually referred to as upper quartile and contains 75% of total data items. It can be described as the median of the upper half the data set.
Formula for the getting the first quartile Q1
Where
L is the lower class boundary of the quartile class.
n is the total frequency
c is the cumulative frequency above the quartile class
i is the class interval
f is the frequency of the lower quartile class
Formula for the getting the second quartile Q2
Second quartile Q2 is actually the median of the data
it is calculated from:
where
L is the lower class boundary of the median class.
n is the total frequency
c is the cumulative frequency above the median class
i is the class interval
f is the frequency of the median class
Formula for the getting the third quartile Q3
where
L is the lower class boundary of the upper quartile class.
n is the total frequency
c is the cumulative frequency above the third quartile class
i is the class interval of the upper quartile class
f is the frequency of the upper quartile class
Deciles
Deciles divides a set of data into ten equal parts.
First decile is when n is divided by 10. that is; Decile = n/10
where n is the total frequency for the data
Percentiles
Percentiles divides a set of data into hundred equal parts.
one percentile is given as (1/100)*n
In quartiles, deciles and percentiles, data is arranged in ascending order
Example 5
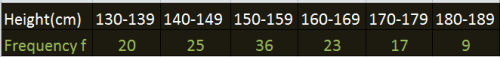
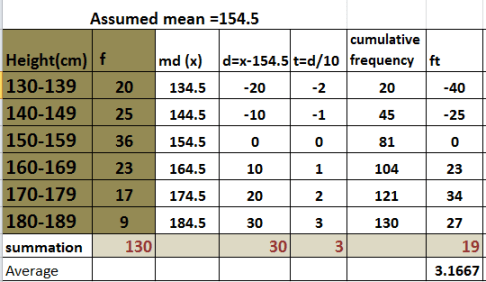
The table below shows the distribution of heights to the nearest cm of students in a school.
Table of heights of some students
Find (a) the median
(b)(i) lower quartile (ii) upper quartile (iii) 80th percentile.
Solution
(a) The new frequency table for the data is shown here
There are 130 students . Therefore, the median height is the 65th student. that is; median is 130/2.
The 65th student falls in the 150-159 class. This class is called the median class.
Using the formula for the median:
(b) (i)
Lower quartile Q1 = L + (n/4 – C)i/f, that is:
ii)
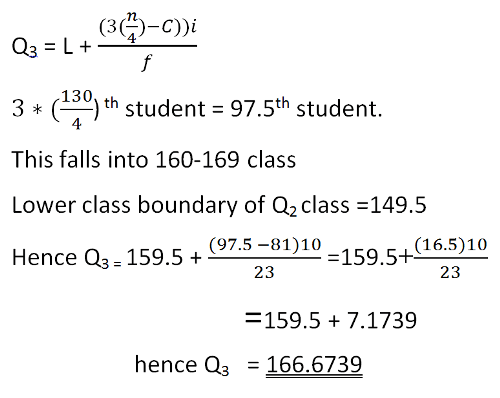
Upper quartile Q3= L + (3n/4)-23)*5/9
(C)
The 80th percentile of the data is given by 80/100)*130=104th value.
The 104th student falls in the 160-169 class
80th percentile= L+(80/100n-C)i/f
The complete solution is as below:
Example
Determine the lower quartile and upper quartile for the following set of data
15, 20, 16, 15, 18, 17, 13, 9, 17, 18, 11
solution
arranging in ascending order
9, 11, 13, 15, 15, 16, 17, 17, 18, 18, 20
The median number is 16. On left of 16 there are 5 values and on the right 5 values.
16 is at the center of the data list
9, 11, 13, 15, 15 | 16 | 17, 17, 18, 18, 20
The first half contains: 9, 11, 13, 15, 15
The central value in that lower half is 13 and it is the first quartile of the data
The upper half includes: 17, 17, 18, 18, 20
The central value is 18 and is hence the upper quartile for the data list
When a surd of order two is squared, a rational product is obtained. For example:
When we have a fraction with surds in the denominator,we can remove the surd in the denominator by multiplying it with a surd that will make the irrational denominator become rational.
The process of multiplying an irrational denominator with another irrational denominator to make it rational is known as rationalizing the denominator.
For example:
please not that multiplying by
is by multiplying by 1. Hence the value has not changed in the fraction.
Multiplying a number by one does not change it’s value.
To rationalize the denominator of a fraction containing a surd (a radical expression), you want to eliminate the surd from the denominator or express it in a form where the denominator does not contain a radical. The steps includes:
i. Identify the surd in the denominator:
Look for the square root or other radical expression in the denominators
ii. Multiply both the numerator and the denominator by a suitable expression:
This expression should eliminate the radical from the denominator. To do this, multiply by the conjugate of the denominator, which is the same as the denominator but with the sign between the terms flipped.
For example, if the denominator is √a + b, then its conjugate is √a – b.
iii. Simplify the expression:
Multiply the terms in the numerator and denominator and combine like terms if possible.
iv. Check for further simplification:
Sometimes, after rationalizing the denominator, you may be able to simplify the resulting expression further by factoring or simplifying.
Example
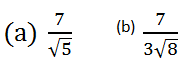
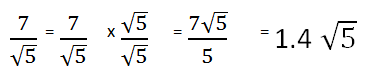
Rationalize the denominators in
solution
(a)
(b)
Note: as you can see from the above workings, the irrational value in the denominator has been removed. Hence, we have rationalized the denominator.
Expanding the product
as shown above, the product of the two irrational sums have resulted to a relational number a-b.
that is :
A conjugate in surds is a surd with an expression such that the product of the two expressions results into a rational number.
One important application of conjugates is in removing of surds in denominators of surds expressions that have fractions. A denominator in the fraction is multiplied by it’s conjugate. A conjugate of a surd expression is usually the same operands whose operators has changed to the opposite sign of the other operands.
When we have removed surd expressions in the denominator, we say that we have rationalized the denominator.
Example
Rational the denominators of the following surds:
Solution
(a)
(b)
Practice Problem
Given that √3 =m, √5 and √13 =p, rationalize the denominator and express your answer in terms of n, m and p.
Contains information related to marketing campaigns of the user. These are shared with Google AdWords / Google Ads when the Google Ads and Google Analytics accounts are linked together.
90 days
__utma
ID used to identify users and sessions
2 years after last activity
__utmt
Used to monitor number of Google Analytics server requests
10 minutes
__utmb
Used to distinguish new sessions and visits. This cookie is set when the GA.js javascript library is loaded and there is no existing __utmb cookie. The cookie is updated every time data is sent to the Google Analytics server.
30 minutes after last activity
__utmc
Used only with old Urchin versions of Google Analytics and not with GA.js. Was used to distinguish between new sessions and visits at the end of a session.
End of session (browser)
__utmz
Contains information about the traffic source or campaign that directed user to the website. The cookie is set when the GA.js javascript is loaded and updated when data is sent to the Google Anaytics server
6 months after last activity
__utmv
Contains custom information set by the web developer via the _setCustomVar method in Google Analytics. This cookie is updated every time new data is sent to the Google Analytics server.
2 years after last activity
__utmx
Used to determine whether a user is included in an A / B or Multivariate test.
18 months
_ga
ID used to identify users
2 years
_gali
Used by Google Analytics to determine which links on a page are being clicked
30 seconds
_ga_
ID used to identify users
2 years
_gid
ID used to identify users for 24 hours after last activity
24 hours
_gat
Used to monitor number of Google Analytics server requests when using Google Tag Manager